


Abstract
Having a well-known history of genome duplication, rice is a good model for studying structural and functional evolution of paleo duplications. Improved sequence alignment criteria were used to characterize 10 major chromosome-to-chromosome duplication relationships associated with 1440 paralogous pairs, covering 47.8% of the rice genome, with 12.6% of genes that are conserved within sister blocks. Using a micro-array experiment, a genome-wide expression map has been produced, in which 2382 genes show significant differences of expression in root, leaf and grain. By integrating both structural (1440 paralogous pairs) and functional information (2382 differentially expressed genes), we identified 115 paralogous gene pairs for which at least one copy is differentially expressed in one of the three tissues. A vast majority of the 115 paralogous gene pairs have been neofunctionalized or subfunctionalized as 88%, 89% and 96% of duplicates, respectively, expressed in grain, leaf and root show distinct expression patterns. On the basis of a Gene Ontology analysis, we have identified and characterized the gene families that have been structurally and functionally preferentially retained in the duplication showing that the vast majority (>85%) of duplicated have been either lost or have been subfunctionalized or neofunctionalized during 50–70 million years of evolution.
INTRODUCTION
Early studies with the first generation of molecular markers indicated the presence of duplicated loci on the genetic maps of various cereals, suggesting ancestral genome duplications and polyploidization events in the history of species that are now considered as diploids ( 1 ). In rice (i) restriction fragment length polymorphism mapping performed in the nineties suggested that chromosomes 1 and 5 ( 2 ) as well as chromosomes 11 and 12 ( 3 ) were ancient duplicates and (ii) comparative genomics studies on the sequence level also suggested ancient polyploidy in rice ( 4–6 ). The release of genome sequence drafts from japonica and indica rice subspecies allowed whole genome sequence comparisons and further characterization of duplications in rice ( 7–11 ). The most recent analysis ( 11 ) concluded that a whole-genome duplication event (involving 10 chromosome-to-chromosome duplication relationships) predated the divergence of cereal genomes 53–94 million years ago, while a more recent, independent duplication event between rice chromosomes 11 and 12 occurred 21 million years ago. Together, these duplications cover 65.7% of the genome. The identification of 163 or even 319 duplicated blocks in the rice genome has recently been published by Lin et al. ( 12 ) and Wang et al. ( 13 ), respectively. Unfortunately, many of these studies were based on low-stringency sequence alignment criteria, such as the direct use of pairwise sequence alignment information through BLAST expect or score values, and did not take into account the density and location of genes to identify precisely the structure and evolution of paralogous regions. Because it is difficult to infer paralogous relationships from sequence comparisons, expertized alignment criteria and statistical validation are required to (i) evaluate objectively and accurately whether the association between two or more genes in the same order on two chromosome segments occurs by chance or truly reflects duplications; (ii) eliminate the presence of massive background noise linked to the identification of artefactual paralogs necessary to produce a unique view of the duplicated nature of the rice genome from either 10 ( 11 ), 163 ( 12 ) or 319 ( 13 ) duplicated regions.
Recently, we have reassessed the duplicated nature of the rice genome based on a combination of (i) new alignment criteria that increase analysis stringency and (ii) statistical tests to re-define interchromosomal duplications ( 14 ). We identified 29 rice duplications covering 72% (267 Mb) of the genome with an average density of one gene every 0.8 Mb involved in the duplications. Ten of the 29 duplications were those previously reported in the literature ( 11 ) covering 47.8% of the rice genome. The remaining 19 duplicated blocks associated with 539 paralogous gene pairs were newly identified in the study. Moreover, the identification of seven paleo-duplicated blocks (among the 29) shared with the wheat, maize and sorghum genomes allowed us to propose a model in which grass genomes have evolved from a common ancestor with a basic number of five chromosomes, by whole genome and segmental duplications, chromosome fusions and translocations.
Gene duplication generates functional redundancy followed by either pseudogenization (i.e. unexpressed or functionless paralog), concerted evolution (i.e. conservation of function for paralog), subfunctionalization (i.e. complementary function of paralog) and neofunctionalization (i.e. novel function of paralog) during the course of genome evolution. Functional divergence either by subfunctionalization or neofunctionalization among duplicated genes is one of the most important sources of evolutionary innovation in complex organisms. Recent studies suggested that a majority of duplicated genes that are structurally retained during the evolution have at least partially diverged in their function ( 15 , 16 ). These studies were based either on (i) systematic studies of the changes in protein sequences through the estimates of synonymous (Ks) or non-synonymous (Ka) substitution per site between paralogs or (ii) the analysis of the timing, location and relative number of gene transcripts available in public expressed sequence tag (EST) databases. However, these approaches are only indirectly related to gene expression as it is generally assumed that (i) variation in substitution rate is not related to variation in the rate of expression divergence ( 17 , 18 ) and (ii) estimation of the level, location and timing of gene expression based on the available EST are limited to the type of cDNA libraries available, and these are not representative of all the spacial and temporal conditions of plant development. Recent micro-array studies in Arabidopsis clearly demonstrated that the vast majority of duplicated genes diverged in their expression profile ( 18–20 ). Ganko et al. ( 18 ) conclude that ∼70% of gene pairs show asymmetric divergence based on micro-array data. Blanc et al. ( 19 ) previously concluded that 57% and 73% of the gene pairs acquired divergent expression patterns for recent and old duplication events in Arabidopsis, respectively.
In order to analyze the impact of rice genome duplications on gene structure and expression, we produced a rice expression map (eMAP), based on expertized micro-array data collected from a unique platform, and compared expression profiles of all paralogous gene pairs identified in the rice genome. This allowed us to provide new insights into the structural and functional evolution of genes after a whole genome duplication event.
MATERIALS AD METHODS
Rice duplication analysis
Rice sequence databases
The sequences of the 12 rice pseudomolecules (build 4; 372 Mb) were downloaded from the TIGR web site ( http://www.tigr.org/tdb/e2k1/osa1/pseudomolecules/info.shtml ) as well as the annotation data for 42 653 genes and 13 237 transposable elements (TEs). The 42 653-gene ftp file was used in this study. Gene sequences (42 653) were used for the analysis of the rice duplications by taking into account the gene position (coordinates) on the pseudomolecules.
Nucleic-acid sequence alignments
We recently defined three new parameters [AL, cumulative identity percentage (CIP) and cumulative alignment length percentage (CALP)] by parsing the BLASTN results and rebuilding high scoring pairs (HSPs) for pairwise sequence alignments ( 14 ). The first, AL (aligned length), is the sum of all the HSP lengths. The second, cumulative identity percentage (CIP = ∑ nb ID/HSP/AL × 100), corresponds to the cumulative percent identity obtained for all the HSPs. The third parameter is cumulative alignment length percentage (CALP = AL/query length). It represents the sum of the HSP lengths (AL) for all the HSPs divided by the length of the query sequence. The CIP and CALP criteria allow identification of the best alignment, i.e. the highest cumulative percent identity in the longest cumulative length, taking into account all HSPs obtained for any pairwise alignment.
Graphical display
Duplications were graphically visualized using the CIRCOS software ( http://mkweb.bcgsc.ca/circos/ ).
Rice micro-array data
Oligo micro-array design and production
Oryza sativa Genome Oligo Set Version 1.0 was designed by Beijing Genomics Institute (BGI) and contained 60 727 70-mer oligos representing both indica and japonica genomes. All oligos were designed from cDNAs, EST sequences, predicted genes of BGI rice genome build and other public resources. The oligo set was spotted onto three Amersham Mirror T7 Star slides ( 21 ).
Plant samples
Samples were collected from Nipponbare ( Oryza sativa, japonica ) plants grown in greenhouse at 28°C. Photoperiod was 12 h and relative humidity was 70%. Seeds were sown in small pots containing 4/5 Neuhaus compost and 1/5 Pouzzolane. Kernels (endosperm and embryo) were sampled at 2 – 3 days after pollination (DAP), 5 – 6 DAP, 15 DAP and 30 DAP. Unfertilized pistils (ovaries and stigmates) were sampled at 2 days before pollination. These samples could be contaminated by pollen during dissection. Leaves were sampled at different growing stages and pooled. Roots were sampled on 12-day-old seedlings grown in sand.
RNA isolation, probe labeling and hybridization
Total RNA were extracted as described by Kay et al. ( 22 ). Quantification was performed using spectrophotometer and quality checked by gel migration.
Oligo array hybridization
mRNA (250 ng) was amplified and cDNA was labeled using Low DNA Input Fluorescent Linear Amplification kit and protocol (Agilent). Fifty nanograms of Cy3 and Cy5 (Amersham) were used for the labeling of the probes. Hybridization were performed with two technical repeats and fluorophore dye swaps using Corning hybridization chambers for 16 h at 37°C with an Amersham hybridization buffer RPK 0325 with 30% formamide.
Additional RNA cleanup and DNase treatment were performed on Qiagen RNAeasy mini column (cat# 74106) according to the manufacturer's instructions. One microgram of total RNA was amplified using the aminoallyl MessageAmp a RNA Kit (Ambion# 1752). Antisense RNA synthesis was performed over 13 h, quality was controlled using the Agilent 2100 Bioanalyser and RNA was quantified with a Nanodrop ND-100. Five micrograms of lyophilized aminoallyl RNA were labeled by coupling of NHS Ester Dyes (Cy5 Mon-Reactive Dye Pack; Amersham # PA25001 et Cy3 Mon-Reactive Dye Pack; Amersham # PA23001) and purified according to the Ambion Aminoallyl MessageAmp a RNA Kit protocol. Fifty picomoles of each of the labeled aRNA (Cy5 and Cy3, respectively) were vacuum dried to a final volume of 9 μl and mixed with 1 μl of Ambion fragmentation buffer (cat# 8740), the solution was incubated 15 min at 70°C and supplemented with 1 μl of the Stop solution (included in the fragmentation buffer packaging) then stored on ice. The two fragmented solutions were mixed to 2.5 μl of 0.1 mg/ml sonicated herring sperm DNA (Sigma), denatured 2 min at 95°C and stored on ice. Then 7.5 μl of hybridization buffer 2 (Amersham RPK0325) and 9 μl of 100% deionized formamide was added to the denatured probe and directly used for hybridization. Hybridizations were performed overnight at 42°C in Corning hybridization chambers. For each biological replicate, a dye swap was performed. Slides were washed once in 1× SSC/0.2%SDS (10 min at 42°C), twice in 0.1× SSC/0.2%SDS (each 10 min at 42°C), twice in 0.1× SSC (each 1 min at room temperature) and 10 s in water at room temperature.
Data processing and normalization
Hybridized slides were scanned on Amersham Gen3 scanner. Data acquisition was performed using software package ArrayVision. Potential sample and dye intensity biases in micro-array data sets were visualized by using log intensity ratio ( M ) − mean log intensity ( A ) scatter plots constructed for each array, in which M [ M = log (Cy5/Cy3) = (log Cy5 − log Cy3)] was plotted against A [ A = (log Cy3 + log Cy5)/2] for each array spot, as described by Yang et al. ( 23 ). Array-specific data normalization of ratio value was then performed by using a robust local regression technique in the LOWESS procedure of LIMMA GUI package ( 24 , 25 ). Normalized data were then back transformed in order to obtain normalized intensity by using the following formula: log Cy3 = A − M /2 and log Cy5 = A + M /2. Intensity log values were finally corrected by median substraction. For a given spot and a given sample, we considered that the level of expression is different from the background when intensity log value >1.5 for root and leaf experiment and intensity log value >1 for the grain experiment. Expression of a given spot was considered significantly different between two samples when associated P -value FDR calculated on M value (with LIMMA GUI package) is <0.1 (less than 10%) of genes discovered to be potentially significant by chance alone. For the grain developmental kinetic, global profiles on the five developmental stages were considered when expression is significantly different between at least two successive samples (FDR threshold).
Expression correlation
To determine a cut-off r value below which duplicated gene pairs can be considered divergent, we calculated a Pearson correlation value ( r ranking from −1 to +1) between the expression profiles of gene pairs. Any gene pairs with r = 0.52 can be considered to be significantly co-regulated at a P -value of 0.05, so we used r < 0.52 as a criterion for determining that two duplicated genes have diverged in expression as described in Blanc and Wolfe ( 19 ).
RESULTS
Rice eMAP
The fourth release of the rice genome annotation ( http://www.tigr.org/tdb/e2k1/osa1/pseudomolecules/info.shtml ) contains 55 890 genes including 13 237 that are related to TEs. The 42 653 non-TE-related genes were used to perform a genome-wide transcriptome analysis based on a rice oligo-array to produce a rice eMAP (cf. Figure 1 A). The oligo-array consisted of 60 727 spots (70-nt oligonucleotides) from the Oryza sativa Genome Oligo Set Version 1.0 designed by Beijing Genomics Institute ( 21 ). When aligning the 60 727 oligonucleotides with the rice genome annotation (TIGR v4), 41 865 genes were associated with single unambiguous rice genes on the basis of at least 90% sequence identity with its associated gene over at least 60 bp, providing evidence of mis- and/or non-annotated genes in rice ( 26 , 27 ). Thus, the transcriptome experiments performed with this array allow us to study the expression pattern of 32 493 genes annotated by TIGR (corresponding to 41 865 spots on the array).
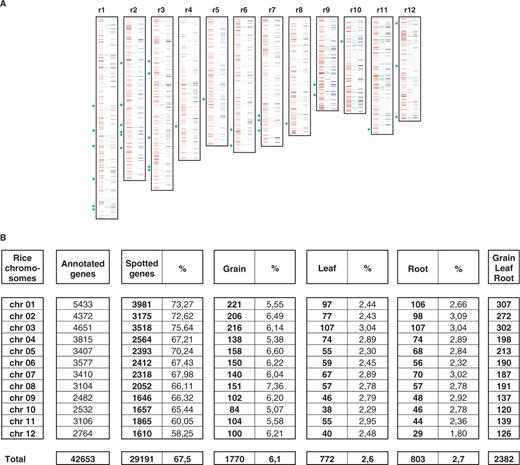
The rice eMAP. ( A ) Graphical representation of the rice genes expressed in the grain (red boxes, left), the leaf (green boxes, center) and the root (blue boxes, right) over the 12 rice chromosomes (vertical blocks). Thirty-two transcription factors expressed at least in one of the tissue involved in the experiment are indicated with a green star at the left side of the 12 chromosomes. ( B ) Number and percentage of annotated genes on the 12 rice chromosomes expressed in grain, leaf and root. For each rice chromosome (lines) are mentioned the number of annotated genes (second column), the number/percentage of spotted genes on the array (third and fourth column), the number/percentage of expressed genes in the grain (fifth and sixth column), the number/percentage of expressed genes in the leaf (seventh and eighth column), the number/percentage of expressed genes in the root (ninth and tenth column) and the number of gene expressed in at leaf one of the three tissues (eleventh column).
We assessed rice gene expression during grain development as well as in root and leaf. The five samples for grain developmental kinetics (two technical replicates for each stage) were harvested just prior to pollination and at 2 – 3, 5 – 6, 15 and 30 days after pollination (DAP). Samples for the root (two technical replicates) and the leaf (two technical replicates), taken at single time points, completed our assessment of gene expression in three major rice tissues. We found 29 191 (89%) genes expressed (i.e. presence of signal) in at least one sample among the 32 493 genes present on the array (from the 42 653 annotated genes from TIGR), among which 2382 genes significantly and differentially expressed in root, leaf grain tissues based on normalized intensity log value as well as P -value FDR thresholds detailed in the materials and methods section ( Figure 1 A and B). The data were integrated into an eMAP giving the position of each gene on the 12 rice chromosomes and its expression profile in root, leaf and grain as blue, green and red lines, respectively ( Figure 1 A). Figure 1 B illustrates that similar numbers of genes, showing a significant expression in at least one of the three tissues, were found on each of the 12 rice chromosomes. In grain, from 84 (r10) to 221 genes (r1) per chromosomes were observed as expressed. In leaf, from 38 (r10) to 107 (r3) expressed genes were identified per chromosome. Likewise, for the root tissue, there were 29 (r12)–107 (r3) genes per chromosomes (cf. Figure 1 B). Detailed raw data concerning (i) the 60 727 spots (Id, sequence), (ii) the 29 191 expressed genes (gene Id, sequence, position) and (iii) the 2382 genes significantly and differentially expressed at least in one of three tissues are available through an interactive web tool located at http://www.clermont.inra.fr/umr1095/rice_duplic/ .
Ren et al. ( 28 ) reported recently the presence of coexpression domains for ∼5% the rice genome based on a data set of 14 789 differentially expressed genes from affymetrix experiments. Moreover, several studies have suggested that coexpressed genes may participate in the same biological pathway ( 29 ). In order to test this hypothesis, 32 annotated transcription factors (TFs) [from a total of 373 TF in TIGR v4 ( 30 )] were selected as associated with a single or several expression profiles in our data set in root (10 genes TF), grain (24 genes TF) and leaf (five genes TF), cf. highlighted with green stars on the Figure 1 A. We performed a gene expression correlation analysis based on these TF (cf. Materials and Methods section). Windows of 100, 300 or 600 genes centered on each TF were selected and the average number of genes within each physical window that were expressed in the same tissue was calculated. For the 24 TF expressed in grain, 5.5 ± 2.5, 13.9 ± 3.2 and 26.9 ± 6.5 genes were co-regulated, i.e. expressed in the grain. Taking into account that for the whole rice eMAP, a total of 1770 (4.1%) genes were expressed in grain, a random co-regulation value would be 4.1% of 100 (i.e. 4.1 genes), 300 (i.e. 12.5 genes) and 600 (i.e. 24.6 genes) genes for each physical window considered. For the five TF expressed in leaf, 2.8 ± 1.1, 7.2 ± 2.6 and 12.8 ± 4.5 genes were co-regulated, respectively, for the three physical windows considered. Since for the whole rice eMAP, a total of 772 among 42 653 (1.8%) genes were expressed in leaves, a random co-regulation value would be 1.8% of 100 (i.e. 1.8 genes), 300 (i.e. 5.4 genes) and 600 (i.e. 10.8 genes) genes for each physical window. Finally, for the 10 TF expressed in root, 2.6 ± 1.4, 7.2 ± 3.2 and 12 ± 5.1 genes are co-regulated, respectively, for the three physical windows considered. The whole rice eMAP showing a total of 803 among 42 653 (1.8%) genes expressed in roots, a random co-regulation value would be 1.8% of 100 (i.e. 1.8 genes), 300 (i.e. 5.6 genes) and 600 (i.e. 11.2 genes) genes for each considered physical window (cf. Figure 2 A). Co-regulation concept can be formulated as a null hypothesis in which this phenomenon exists if the average number of genes that were expressed in the same tissue within a 100, 300 or 600 gene-window centered on the 32 FT is higher than what could be expected at random (based on the whole eMAP). The number of genes that could be expected to be expressed in the same tissue in a gene-window is defined by taking into account that, at the genome-wide level, 1770, 772 and 803 genes are expressed in the grain, the leaf and the root, respectively. The co-regulation effect (null hypothesis) is visible in Figure 2 A where in every gene-window centered on the 32 TF, the average number of genes expressed in the same tissue is higher than what could be expected at random. However, the Figure 2 B represents the 24 TF that are expressed in grain associated with the genes expressed in the same tissue within a 100 gene-window. Even if a clear co-regulation effect has been identified at the tissue level (cf. Figure 2 A), when considering the detailed expression kinetic, the expression pattern of the genes within the cluster profiling are very different and not correlated (Pearson cut-off value of 0.52), with the exception of clusters #13, #21 and #22. If the co-regulation phenomenon does exist for given plant tissues, based on their developmental kinetics, it is only moderate and has to be considered with caution.
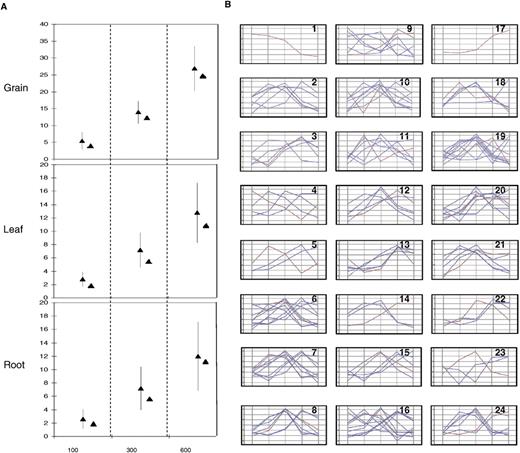
Co-regulation pattern of 32 trancription factors. ( A ) The average number (±SD) of genes that are expressed in the same tissues for the 32 transcription factors in a physical window of 100, 300 and 600 genes are schematically represented for the grain, the leaf and the root micro-array data. The number of genes that are expected to be expressed at random in the three tissues for the same physical window based on the whole eMAP are mentioned (closed triangle). ( B ) Expression pattern of the genes expressed in the grain in a 100 genes window centered on the 24 TF expressed in the grain (five stages). Within 24 boxes are shown the expression profile of a single TF (red) as the other genes (blue) expressed in the grain within a 100 gene physical window centred on the considered TF.
Improved identification of duplicated regions in the rice genome
We recently published a refined analysis of the duplicated nature of the rice genome ( 14 ) identifying 29 duplications between chromosomes r1–r2/3/5/10/12, r2–r4/6/7/8/12, r3–r7/9/10/11/12, r4–r5/8/10, r5–r9/11/12, r6–r7/8/12, r7–r8, r8–r9/11, r9–r11 and r11–r12). These 29 duplications can be divided into two groups. The 10 major duplications (between chromosomes r1–r5, r2–r4/6, r3–r7/10/12, r4–r8/10, r8–r9 and r11–r12) cover 47.8% of the rice genome. The 19 additional duplicated regions (between chromosomes r1–r2/3/10/12, r2–7/8/12, r3–r9/11, r4–r5, r5–r9/11/12, r6–r7/8/12, r7/r8, r8–r11 and r9/r11) correspond to duplicated regions (i) not identified previously; (ii) superimposed on previous major duplications; (iii) small in physical size. They define novel relationships between the chromosomes and represent 24.2% of the genome. Thus, in total, the 29 duplications cover 72% (267 Mb) of the rice genome.
In order to compare the expression profile between paralogous genes in rice, we have refined our previous analysis and then performed expertized alignments of sister blocks one by one from the 10 major duplicated blocks to identify precisely the number of paralogous gene pairs that had not been performed in our recent study ( 14 ). The 11 628 genes contained in the 10 block pairs were aligned [BLASTN ( 31 , 32 )] using three new parameters for analysis: AL for aligned length, CIP for cumulative identity percentage and CALP for cumulative alignment length percentage (cf. Materials and methods section). With these parameters, BLAST produced the highest cumulative percent of identity on the longest cumulative length, thereby increasing the stringency in defining conservation between chromosome sequences. The rice block sequences were aligned against themselves (BLASTN) using 70% CIP and 70% CALP as cutoff to identify duplicated gene pairs. Paralogous genes (1440) were identified between r1–r5 (two blocks, 251 genes), r2–r4 (127 genes), r2–r6 (two blocks, 392 genes), r3–r7 (two blocks, 96 genes), r3–r10 (63 genes), r3–r12 (75 genes), r4–r8 (16 genes), r4–r10 (12 genes), r8–r9 (89 genes) and r11–r12 (319 genes) (cf. Figure 3 A and B and Supplementary Data 2). Detailed raw data regarding the 1440 paralogous pairs (rice LOC, position on chromosome, sequence and alignments criteria) are available through an interactive web tool located at http://www.clermont.inra.fr/umr1095/rice_duplic/ . The use of our new parameters yielded 1440 paralogs based on a pairwised alignment of the 10 sister blocks and seemingly improved the resolution of our previous rice duplication analysis yielding 539 paralogs based on a genome-wide analysis ( 14 ).
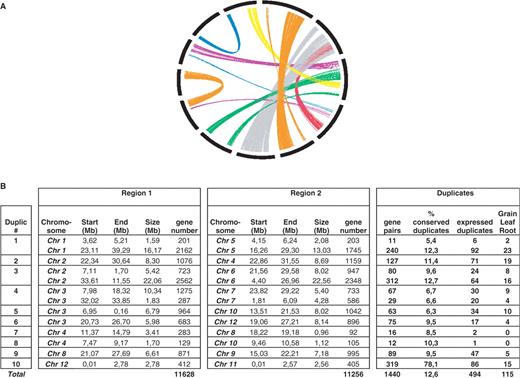
Identification of 10 duplicated regions in rice. ( A ) Schematic representation using the CIRCOS software (cf. Materials and methods) of 1440 couples of paralogous genes (linked by thin lines) defining 10 duplication blocks (in different colors) on 12 rice chromosomes (thick bars). ( B ) The chromosome number, start and end positions and the size of the region in Mb are provided for each of the duplicated (region 1 to region 2) regions. The number of genes identified in each region is provided as well as the cumulative size of the duplication and the average gene density in gene/Mb.
The largest duplication (duplication #3 in Figure 3 B) was found for a region of 22.06 Mb located on chromosome 2, which has a paralogous counterpart on a 22.56 Mb region of chromosome 6, corresponding to a cumulative region size of 44.62 Mb involving 312 paralogs, i.e. an average density of one paralogous gene every 71.5 kb. The most gene-dense duplicated region (duplication #10 in Figure 3 B) involved a small region between r12 (2.78 Mb) and r11 (2.56 Mb) with 319 paralogs, i.e. an average density of one paralogous gene every 8.4 kb. This density was expected as the r11–r12 duplication event had been reported to be the most recent and, consequently, the most highly conserved ( 11 , 14 ). The identification of 10 known duplication blocks with the highest number of paralogous gene pairs (i.e. 1440 single copy paralogs) compared to previous data [i.e. 772 ( 11 ), 529 ( 14 ) and 539 ( 33 )] clearly demonstrated that the introduction of new alignment criteria (CIP and CALP parameters) increased the stringency of the analysis, re-defined interchromosomal duplications in rice and was suitable for the comparative analysis of the expression profile between gene pairs.
Comparative expression profiling of paralogous genes in rice
When we compared the 1440 paralogous gene pairs to the 2382 expressed genes, we identified 115 gene pairs for which at least one gene copy was significantly expressed in one of the three tissues but only 14 gene pairs with significant expression for both copies. The remaining paralogous pairs were either not present on the array or not differentially expressed in our experiment. This result contradicts recent findings from genome-wide transcription analyses in rice using tiling arrays developed by Li et al. ( 26 ), in which the authors examined the transcriptional relationship between 1217 (compared to 1440 in the present study) marker pairs defining the same duplication events described here. They concluded that there was no significant difference in expression between the two genes forming paralagous pairs for all the duplications except some pairs of r4–r10 and r8–r9. Both the array and the probe used by the authors were fundamentally different from ours; in fact, they used a rice genome wide tiling array and, more importantly, a cDNA mixture from different tissues (shoots, roots, panicules and suspension cultures) rather than separate probes from each tissue. The mixed nature of the probe may well have masked expression differences in particular tissues, if both genes are expressed more strongly in a second tissue. In addition, the correlation was calculated on average intensity values that made it difficult to identify precise cut-off values to distinguish background noise from significant expression. In our data set, 88% of the gene pairs present were associated with a complete loss of expression for one of the paralogs in one of the three tissues involved. Figure 4 A illustrates the percentage of paralogous couples for which only one copy was expressed in a given tissue (neofunctionalization) or for which both copies are expressed (conserved function). Considering a total of 84 paralogous gene pairs for the grain, 37 for the leaf and 55 for the root, for respectively 88%, 89% and 96% of them only one paralogous copy is expressed in the considered tissue, leading to the conclusion that a vast majority of paralogous pairs were neofunctionalized.
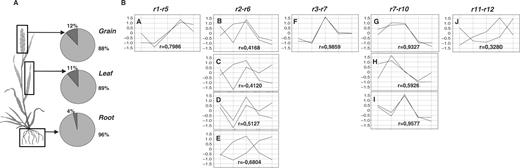
Comparative expression pattern of rice paralogs. ( A ) Percentage of conserved expression (purple) and neofunctionalization (blue) between rice paralogs in the grain, the leaf and the root tissues. ( B ) Ten comparative expression profiles between rice paralogs expressed in the grain. Within 10 boxes are shown the expression profiles observed in the grain for paralogous gene pairs corresponding to the duplications between r1–r5, r2–r6, r3–r7, r7–r10 and r11–r12.
A more detailed analysis of the 10 (out of 37) paralogous couples, for which both genes of a pair were clearly expressed in grain, showed that the percentage of neofunctionalization was even higher. Figure 4 B presents the expression kinetics of the 10 paralogous couples during grain development. Through a Pearson correlation analysis (cut-off value of 0.52) of the 10 pairs of expression profiles, 4 (40%) paralogs had non-identical patterns (profiles B, C, E and J in Figure 4 B) suggesting subfunctionalization, whereas the 6 (60%) remaining paralogs presented the same pattern (profiles A, D, F, G, H and I in Figure 4 B) consistent with a conserved function. It is not surprising to note that the single paralog couple associated with an expression profile in the grain and located in the recent rice duplication between r11 and r12 presented a different profile since these regions have been shown to be rich in disease resistance genes and to evolve rapidly ( 34 ). Finally, our results show that even if the two paralogs are expressed in the same tissues, detailed analysis in a developmental kinetic experiment may show a divergence in expression profile. Here, among the initial 84 paralogs, only six (7.1%) are finally truly representative of an expression redundancy in grain. These results suggest that since the duplication occurred in the rice genome ancestor 50–70 million years ago (MYA), most duplicated genes have diverged in their expression profiles via neo- or subfunctionalization.
Gene ontology (GO) classification of rice paralogs
The 42 653 annotated genes at TIGR are classified into 65 GO classes (available at http://gnn.tigr.org/tdb/e2k1/osa1/GO.retrieval.shtml ). Figure 5 A represents the number of rice genes (pink line) among the 42 653 genes that are in the same GO class. In an attempt to identify the gene functions that are particularly retained or lost during the evolution after the duplication event, we represented with blue bars on the Figure 5 A the percentage of paralogous genes among the 1440 duplicates described previously for each of the 65 GO classes. The highest percentage of paralogs (12.49%) is obtained for the ‘endogenous stimuli’ gene function. Finally, no clear bias is identified for gene function that may have been preferentially retained in duplication blocks as among the 65 GO classes, as the percentage of paralogous gene fits the number of rice genes associated with the considered GO classes; indicating a random process of the paralogous gene loss phenomenon within duplicated blocks.
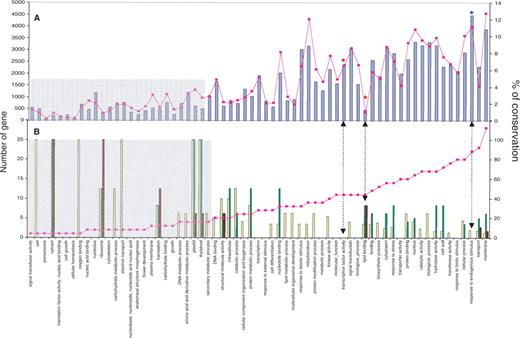
Functional classifications of rice paralogs. ( A ) The pink line represents the number ( y axes at the left) of rice genes (among the 42 653) associated with the GO classes. The blue bars represent the percentage ( y axes at the right) of rice paralogs (among the 1440) associated with the same GO classes. ( B ) The pink line represents the number ( y axes at the left) of expressed rice paralogs within the eMAP (i.e. 115 genes) associated with the GO classes. The bars represent the percentage ( y axes at the right) of paralogs that have retained the same expression pattern in the root (brown), leaf (green) and grain (yellow).
In an attempt to identify the gene functions that have retained the same expression pattern or have been preferentially neo- or subfunctionalized within duplicated blocks during the evolution after the duplication event, we represented in the Figure 5 B fo the 65 GO classes the percentage (vertical bars) of paralogs that have the same expression pattern in root (brown), leaf (green) and grain (yellow) among the 115 expressed gene pairs available, for a corresponding number of genes (pink line) among the 1440 paralogs identified for the considered GO classes. Finally, clear biases are identified for gene functions that have retained the same expression within duplicated blocks as among the 65 GO classes, as the percentage of expressed paralogs does not fit the number of rice paralogs available; indicating a nonrandom process of neo- or subfunctionalization phenomenon. GO classes that are preferentially impacted structurally (gene loss) and functionally (neo- or subfunctionalization) during the evolution after the whole genome duplication (WGD) event are discussed in details in the next section.
DISCUSSION
Structural divergence between rice paralogous blocks
Re-analysis of the duplication within the rice genome based on improved sequence alignment criteria allowed the identification of 1440 gene pairs originating from paleo duplication in rice. These paralogs define 10 chromosome to chromosome duplication relationships involving 11 628 annotated genes. In total, 2880 (i.e. 1440 gene pairs) of the 22 884 genes present on the duplicated segments are structurally conserved in the duplicated regions. Since the time when these 10 duplications occurred as part of a whole genome duplication event (WGD) 50–70 million years ago, 87.4% of the duplicated genes have lost their orthologous counterparts. It is noteworthy that no sister blocks were identified as part of a centromeric region. Although transcribed genes are known to be present in these parts of the genome ( 35 ), these regions are rich in repeated elements that decrease the number of links between possible sister regions, leaving them difficult to detect by any BLAST alignment strategy. When considering the 65 GO classes associated with the 1440 rice paralogs, no bias is identified for gene function that may have been retained in duplication blocks suggesting that gene loss within duplicated chromosomal regions is a random process.
Our results are consistent with recent findings on the duplicated nature of the Arabidopsis genome where ∼20% of paralogs are retained within duplicated segments ( 36 ). More precisely, the authors stated that ∼28% and ∼13.5% of duplicated genes are retained in recent (date back to 24–40 MYA) and old (date back to the monocot/dicot divergence) duplication blocks, respectively ( 36 , 37 ). Our data on rice duplication (i.e. 12.6% of paralogs retained in sister blocks after 50–70 MY of evolution) combined with Blanc et al. ( 36 ) data on Arabidopsis duplication (i.e. 13.5% of paralogs retained in sister blocks after a double period, 100 MY, of evolution) clearly establish that gene loss after polyploidization is not a linear process. This concept is already visible between the 10 major duplication blocks in rice where 78.1% of the duplicates are retained within the r11–r12 duplication that date back between 14 and 27.3 MYA, whereas 12.3% of the duplicates are retained within the longest duplicated segment between r1 and r5 that date back 53.2–76.3 MYA ( 14 ). Associated with recent data obtained in dicots (i.e. Arabidopsis), our results clearly demonstrate that most of the genetic redundancy originating from polyploidy events is erased by a massive loss of duplicated genes by pseudogenisation in one of the duplicated segments soon after the polyploidization event ( 38 ).
Expression divergence between rice paralogous blocks
Detailed analysis of 115 gene pairs (from the 1440 paralogs) for which at least one copy is associated with significant expression (out of the 2382 profiles of the eMAP), clearly shows that 88%, 89% and 96% have diverged in their expression pattern in grain, leaf and root, respectively. When considering the 65 GO classes associated with 115 expressed gene pairs among the 1440 rice paralogs as described previously, clear biases are identified for gene functions that have retained the same function within duplicated blocks indicating a nonramdom process of gene expression divergence. The ‘endogenous stimuli’ gene function (blue star on the Figure 5 A) associated with the highest percentage of paralog (12.49%) is preferentially retained in duplication blocks and is also the GO class that represents the lowest percentage of conserved expression between paralogs (i.e. 0% in leaf, root and 7.7% in grain). Moreover, the red stars in the Figure 5 represent the highly contrasted GO classes in term of conserved function between paralogs. The ‘lipid binding’ gene family corresponds to the GO class associated with the highest percentage of expression redundancy between paralogs in the three tissues (33.3% for leaf, root and 14.3% for grain). In contrast, the ‘TF’ gene family corresponds to the GO class associated with absence of expression redundancy even though the percentage of paralogs identified in this gene class was high, i.e., 6.57% of paralogs among 2360 rice genes.
Previous studies in yeast and humans have also suggested a rapid phase of initial divergence between duplications ( 39–41 ). Moreover, our results are consistent with recent findings of Blanc et al. ( 19 ) where 57% (of 1137 genes pairs for young duplications) to 73% (of 420 gene pairs for old duplications) have diverged in expression based on a computational analysis of 62 Affymetrix micro-arrays experiment in Arabidopsis. Our data indicate a greater percentage of expression divergence. However, Blanc et al. ( 19 ) mentioned that the 73% of pairs that have diverged in expression in the context of old duplications is an underestimate if cross-hybridization occurred at a high rate in their experiment.
Because many genes exert their function through interaction networks, a change in the expression pattern of one gene could drag along changes in the expression pattern of genes present in the same functional pathway. This could explain why we did not detect any difference in expression divergence for gene pairs present in the recent duplication between r11 and r12 dating back to 21 MYA compared with the other paleo-duplications suggested as part of a WGD dated between 53 and 94 MYA ( 11 , 14 ). Even if our estimates of expression divergence between gene pairs may be an underestimation of the true proportion of divergent pairs in rice, because the expression data set analyzed here is necessarily only a sampling of all the possible environmental conditions or tissues where the duplicated genes may be expressed, a large majority of the polyploidy-derived duplicated genes in rice have acquired divergent functions. Haberer et al. ( 42 ) noted that tandem as well as segmental duplicate gene pairs had divergent expression in Arabidopsis even when they shared many similar cis-regulatory sequences and suggested that changes to a small fraction of cis-elements could be sufficient for neofunctionalization or subfunctionalization. Finally, epigenetic differences between duplicates may contribute to rapid expression differentiation. Wang et al. ( 43 ) observed silencing of polyploidy-derived duplicates due to hypermethylation in Arabidopsis polyploids. Epigenetic mechanisms as well as interaction networks may be the origin of a extremely rapid expression divergence of gene duplicates soon after polyploid events.
Time scale of structural and expression shuffling after duplications
We concluded that our analysis supports the hypothesis that (i) only 12.6% of 22 884 paralogous genes are retained within rice sister blocks for which (ii) the expression pattern shift identified for more than 88% of the 115 gene pairs available is significantly impacted by neofunctionalization or subfunctionalization after duplication. Moreover, this data, identified for the 10 major duplications in rice, will apply to any cereal genome as these paleo-duplications have been suggested to correspond to a WGD that occurred before the cereal divergence from a common ancestor 50–70 MYA ( 11 , 14 ). Given the prevalence of gene and genome duplication in the evolutionary history of plants, evolution of development in angiosperms may differ from organisms where genome duplication is rare and where extensive expression divergence after duplication would have a profound impact on the evolution of developmental and regulatory networks. Our data support the idea that after 50–70 million years of evolution since the genome has undergone a polyploidization event, the vast majority of the paralogous genes have been lost within a sister block and that the remaining gene couples have largely diverged in their expression profile.
A survey in gene expression variation between A. thalina and A. arenosa , which derived from a common ancestor ∼1.5 MYA, clearly established ∼2.5% of gene expression differences ( 44 ). Changes in gene expression can occur immediately after polyploidy formation or may need sometimes only two generations to establish expression status ( 33 , 45 ). This trend toward silencing (or gene loss via pseudogenization) or expression shift (via neo- or subfunctionalization) of a particular locus soon after a polyploid event may be advantageous for adaptation and establishment of a successful polyploid genome. Our data (i.e. >88% of expression divergence in rice within a 50–70 MY of evolution) complement previous findings [i.e. 2.5% and 57% of expression divergence in Arabidopsis within respectively a ∼1.5 MY and ∼32 MY of evolution ( 36 , 44 )] demonstrated that within ∼30 MY of evolution after a polyploidization event, more than 50% of the paralogs have been either lost or have been sub- or neofunctionalized in plants.
CONCLUSION
The access to large structural (genome sequences) and functional (micro-array data experiments) genomic resources gives a new insight into the impact of paleo polyploidy in plant. However, the present study demonstrates that in a short time scale after polyploidization, a large majority of duplicated genes are no longer maintained intact in the genome. Among those maintained, a vast majority have diverged in their expression pattern. This is a key process in creating biological novelties or adaptation to ecological environments by avoiding redundant function soon after duplication and by removing selection pressure allowing gene copy to evolve faster through subfunctionalization or neofunctionalization.
FUNDING
Data included in the current article including comparative genomics data as well as transcriptomics data were generated within programs partially funded by GENOPLANTE. Funding for open access charge: National French Cooperative Plant Genomics Program http://www.genoplante.com/ .
Conflict of interest statement . None declared.
REFERENCES
Author notes
The authors wish it to be known that, in their opinion, the first three authors should be regarded as joint First Authors.

Comments