


Abstract
Rational classification of proteins encoded in sequenced genomes is critical for making the genome sequences maximally useful for functional and evolutionary studies. The database of Clusters of Orthologous Groups of proteins (COGs) is an attempt on a phylogenetic classification of the proteins encoded in 21 complete genomes of bacteria, archaea and eukaryotes (http://www.ncbi.nlm.nih.gov/COG ). The COGs were constructed by applying the criterion of consistency of genome-specific best hits to the results of an exhaustive comparison of all protein sequences from these genomes. The database comprises 2091 COGs that include 56–83% of the gene products from each of the complete bacterial and archaeal genomes and ~35% of those from the yeast Saccharomyces cerevisiae genome. The COG database is accompanied by the COGNITOR program that is used to fit new proteins into the COGs and can be applied to functional and phylogenetic annotation of newly sequenced genomes.
Received September 3, 1999; Revised September 25, 1999; Accepted October 4, 1999.
INTRODUCTION
The recent progress in genome sequencing has led to a rapid enrichment of protein databases with an unprecedented variety of deduced protein sequences, most of them without a documented functional role. Computational biology strives to extract the maximal possible information from these sequences by classifying them according to their homologous relationships, predicting their likely biochemical activities and/or cellular functions, three-dimensional structures and evolutionary origin. This challenge is daunting, given that even in Escherichia coli, arguably the best-studied organism (1), only ~40% of the gene products have been characterized experimentally (2). On the other hand, computer analysis of complete microbial genomes has shown that prokaryotic proteins are in general highly conserved, with ~70% of them containing ancient conserved regions (ACRs) (3). This allows one to transfer functional information from experimentally characterized proteins to their homologs from poorly studied organisms. For such functional predictions to be reliable, it is critical to infer orthologous relationships between genes from different species. Orthologs are direct evolutionary counterparts related by vertical descent as opposed to paralogs which are genes within the same genome related by duplication (4,5). Typically, orthologous proteins have the same domain architecture and the same function although there are significant exceptions and complications to this generalization, particularly among multicellular eukaryotes (6).
The Clusters of Orthologous Groups of proteins (COGs) database has been designed as an attempt to classify proteins from completely sequenced genomes on the basis of the orthology concept (7). The COGs reflect one-to-many and many-to-many orthologous relationships as well as simple one-to-one relationships (hence Orthologous Groups of proteins). The original set included the proteins from five bacterial, one archaeal and one eukaryotic genomes and consisted of 720 COGs; subsequently, a sixth bacterial genome was added, with the number of COGs increasing to 860 (8). Here we report the current status of the COG database which now consists of 2091 COGs and includes proteins from 21 complete genomes.
CONSTRUCTION OF THE COGs
COGs have been identified on the basis of an all-against-all sequence comparison of the proteins encoded in complete genomes using the gapped BLAST program (9) after masking low-complexity and predicted coiled-coil regions (7). The COG construction procedure is based on the simple notion that any group of at least three proteins from distant genomes that are more similar to each other than they are to any other proteins from the same genomes are most likely to belong to an orthologous family. This prediction holds even if the absolute level of sequence similarity between the proteins in question is relatively low and thus the COG approach accommodates both slow-evolving and fast-evolving genes. Briefly, COG construction includes the following steps.
1. Perform the all-against-all protein sequence comparison.
2. Detect and collapse obvious paralogs, that is, proteins from the same genome that are more similar to each other than to any proteins from other species.
3. Detect triangles of mutually consistent, genome-specific best hits (BeTs), taking into account the paralogous groups detected at step 2.
4. Merge triangles with a common side to form COGs.
5. A case-by-case analysis of each COG. This analysis serves to eliminate false-positives and to identify groups that contain multidomain proteins by examining the pictorial representation of the BLAST search outputs. The sequences of detected multidomain proteins are split into single-domain segments and steps 1–4 are repeated with these sequences, which results in the assignment of individual domains to COGs in accordance with their distinct evolutionary affinities.
6. Examination of large COGs that include multiple members from all or several of the genomes using phylogenetic trees, cluster analysis and visual inspection of alignments; as a result, some of these groups are split into two or more smaller ones that are included in the final set of COGs.
By the design of this procedure, a minimal COG includes three genes from distinct phylogenetic lineages (protein sets from closely related species, such as, for example, Mycoplasma genitalium and Mycoplasma pneumoniae were merged prior to COG construction). The approach used for the construction of COGs does not supplant a comprehensive phylogenetic analysis. Nevertheless, it provides a fast and convenient short-cut to delineate a large number of families that most likely consist of orthologs.
Once the COGs have been identified using the above procedure, new members can be added using the COGNITOR program that is based on the same idea of the consistency between genome-specific best hits. If a protein sequence, when compared to the COG database, gives two or more best hits into the given COG, the protein in question is a candidate member of the COG.
To create the current set of COGs, the COGNITOR program was used to fit the protein sets from 12 complete bacterial and archaeal genomes into the 860 previously delineated COGs. The candidate COG members identified using the two-best-hit approach were further evaluated by a case-by-case examination of sequence alignments to verify significance of the relationships and the conservation of salient features of the proteins in the COGs, such as domain architecture and active centers of enzymes. Those of the proteins from the 12 new genomes that could not be included in the pre-existing COGs were analyzed using the original procedure for COG construction. The newly formed COGs were combined with the pre-existing ones to form the updated COG collection.
STATISTICS OF THE COG DATABASE
1252COGs (~60%) are simple families, with no paralogs or with paralogs from one lineage only. These are unlikely to undergo modifications as a result of further analysis and/or accumulation of new genomic data (but new genomes will most likely add to these simple COGs) and in most, if not all, cases allow a straightforward transfer of functional information from functionally characterized genes from model systems, such as E.coli and yeast, to those from poorly characterized genomes. The remaining COGs contain paralogs from more than one species and, accordingly, may include evolutionarily and functionally distinct subgroups. Some of these subgroups may become separate COGs with further accumulation of genomic data. Furthermore, for some of the largest groups included in the COG set, such as, for example, families of DNA and RNA helicases or SAM-dependent methyltransferases, establishing true orthologous relationships is extremely difficult. These COGs include experimentally characterized proteins with similar biochemical activity (e.g., methyltransferase) but possess different functions (e.g., transfer methyl groups to different substrates). Thus only very general functional predictions are possible for poorly characterized members of such COGs.
The fraction of the proteins that belong to the COGs and thus represent ancient families conserved across a wide phylogenetic range is between 56 and 83% for the bacterial and archaeal genomes, with an average of 67% (Fig. 1). Notably, this value is close to 70%, the previous estimate of the proteins encoded in each genome that contains ancient conserved regions (3). Aquifex aeolicus, which has the smallest genome among the sequenced free-living prokaryotes, is most completely represented in the COGs, which may reflect the preferential use of highly conserved proteins for house-keeping functions, whereas specialized parasitic bacteria, such as Mycobacterium or Borrelia, are relatively poorly represented (Fig. 1). The fraction of the yeast proteins currently included in the COGs is much lower than for any of the prokaryotes (Fig. 1), indicating the prevalence of eukaryote-specific families.
The COGs were classified into 17functional categories that loosely follow those introduced by Riley (10) and also include a class for which only a general functional prediction (e.g., that of biochemical activity) was feasible as well as a class of uncharacterized COGs. A significant majority of the COGs could be assigned to one of the well-defined functional categories but the measure of our ignorance is apparent from the fact that the single largest category is the functionally uncharacterized COGs (Fig. 2).
In the original COG analysis, we introduced the notion of a phylogenetic pattern, i.e., the pattern of species that are represented or not represented in a given COG; alternatively, phylogenetic patterns can be described in terms of the sets of COGs that are represented in a given range of species. A broad diversity of phylogenetic patterns has become immediately apparent. This conclusion was reinforced by the analysis of the new data set, which includes only a small fraction of universal COGs, whereas COGs represented only in three or four species are most abundant (Fig. 3). This patchy distribution of phylogenetic patterns is likely to reflect the major role of horizontal gene transfer and lineage-specific gene loss in the evolution of prokaryotes (11) as well as rapid evolution of certain genes in specific lineages, which is probably linked to functional changes.
APPLICATIONS OF THE COGs
The most straightforward application of the COGs is for the prediction of functions of individual proteins or protein sets, including those from newly completed genomes. This is done by fitting proteins into the COG using the COGNITOR program. Given that with the increase of the number of genomes included in the COGs, the likelihood of two BeTs for the given protein falling into the same COG by chance also increases, the current cut-off for assigning proteins to COGs is set at three BeTs. The user can increase the stringency of the analysis by resetting the cut-off at a greater number of BeTs. The requirement of multiple BeTs for a protein to be assigned to a COG, to some extent, serves as a safeguard against the propagation of errors that might be present in the COGs database. Indeed, if a COG contains one or even two false-positives, this will not result in a false assignment by COGNITOR under the three-BeT cut-off. It should be noted that the interpretation of COGNITOR results for COGs containing paralogs (see above) requires caution to avoid overly specific functional predictions.
The COGs also provide opportunities for more sophisticated queries. In particular, it is possible to systematically identify those conserved families (COGs) that are missing in a given genome. This information can be utilized to either detect the respective genes that might have been missed during genome annotation or to search for an alternative cognate of the given function among the gene products. The COG WWW site (see below) offers automatic means to isolate all COGs with a particular phylogenetic pattern, for example those that are found only in pathogenic bacteria. This effectively provides the functionality of ‘differential genome display’ (12) and can be helpful for delineating sets of candidate proteins for a particular range of functional features, e.g., virulence or hyperthermophily. More generally, the COG system is a convenient platform for a variety of evolutionary-oriented analyses of protein families.
THE COG WWW SITE, DATA PRESENTATION AND AVAILABILITY
The COG WWW site (http://www.ncbi.nlm.nih.gov/COG ) contains the following principal types of data: (i) list of all COGs organized by the (predicted) functional category and hyperlinked to (ii) individual COG pages. Each of the COG pages shows the respective phylogenetic pattern and is hyperlinked to: 1) pictorial representations of BLAST search outputs for each member of the COG, which also includes links to the respective GenBank and Entrez-Genomes entries, 2) a multiple alignment of the COG members produced automatically using the ClustalW program (13), and 3) a cluster dendrogram generated using the BLAST scores as the measure of similarity between proteins; (iii) the COGNITOR page where a protein sequence can be pasted, searched against the database of proteins from complete genomes and assigned to a COG as described above; (iv) a phylogenetic pattern search tool; (v) a matrix of co-occurrence of genomes in COGs. The COG data set and the COGNITOR program also are available by anonymous ftp at ftp://ncbi.nlm.nih.gov/pub/COG
ACKNOWLEDGEMENTS
We are grateful to David Lipman for his critical contribution at the initial stage of the COG project and constant support and inspiration, and to Nick Grishin, Jim Ostell, Tatiana Tatusov and Yuri Wolf for helpful discussions.
To whom correspondence should be addressed. Tel: +1 301 435 5913; Fax: +1 301 480 9241; Email: koonin@ncbi.nlm.nih.gov
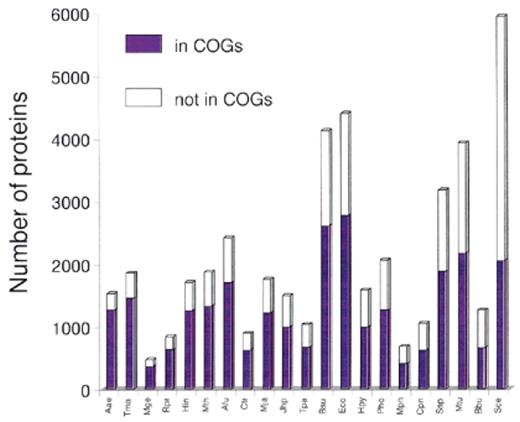
Figure 1. Representation of the protein sets from complete genomes in the COGs. The data are sorted by the decreasing fraction of proteins included in the COGs (from left to right). Species names: Aae, Aquifex aeolicus; Tma, Thermotoga maritima; Mge, Mycoplasma genitalium; Rpr, Rickettsia prowazekii; Hin, Haemophilus influenzae; Mth, Methanobacterium thermoautotrophicum; Afu, Archaeoglobus fulgidus; Ctr, Chlamydia trachomatis; Mja, Methanococcus jannaschii; Jhp, Helicobacter pylori J strain; Tpa, Treponema pallidum; Bsu, Bacillus subtilis; Eco, Escherichia coli; Hpy, Helicobacter pylori; Pho, Pyrococcus horikoshii; Mpn, Mycoplasma pneumoniae; Cpn, Chlamydia pneumoniae; Ssp, Synechocystis sp.; Mtu, Mycobacterium tuberculosis; Bbu, Borrelia burgdorferi; Sce, Saccharomyces cerevisiae.
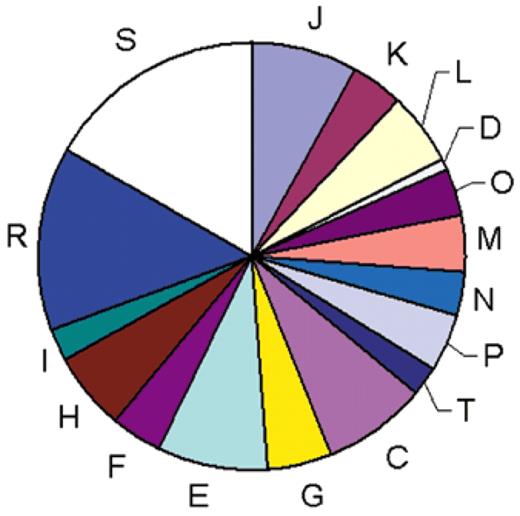
Figure 2. Classification of the COGs by functional categories. One-letter abbreviations for the functional categories: J, translation, including ribosome structure and biogenesis; L, replication, recombination and repair; K, transcription; O, molecular chaperones and related functions; M, cell wall structure and biogenesis and outer membrane; N, secretion, motility and chemotaxis; T, signal transduction; P, inorganic ion transport and metabolism; C, energy production and conversion; G, carbohydrate metabolism and transport; E, amino acid metabolism and transport; F, nucleotide metabolism and transport; H, coenzyme metabolism; I, lipid metabolism; D, cell division and chromosome partitioning; R, general functional prediction only; S, no functional prediction.
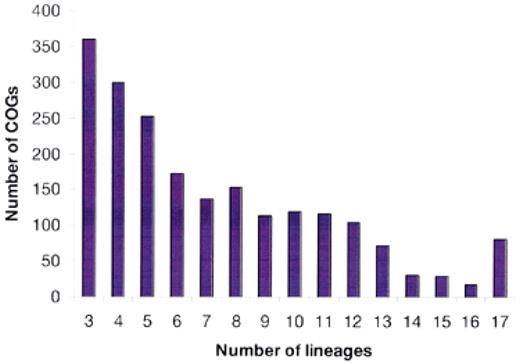
Figure 3. Distribution of the COGs by the number of phylogenetic lineages. Typically, a lineage is represented by only one species. However, the following pairs of (relatively) close bacterial species were merged and treated as a single entity prior to the COG construction: Mycoplasma genitalium and Mycoplasma pneumoniae, Chlamydia trachomatis and Chlamydia pneumoniae, Escherichia coli and Haemophilus influenzae, and two strains of Helicobacter pylori.
References
1 Neidhardt,F.C., Curtiss,R.,III, Ingraham,J.L., Lin,E.C.C., Low,K.B., Magasanik,B., Reznikoff,W.S., Riley,M., Schaechter,M. and Umbarger,H.E. (eds) (
6 Henikoff,S., Greene,E.A., Pietrokovski,S., Bork,P., Attwood,T.K. and Hood,L. (
9 Altschul,S.F., Madden,T.L., Schaffer,A.A., Zhang,J., Zhang,Z., Miller,W. and Lipman,D.J. (

Comments